
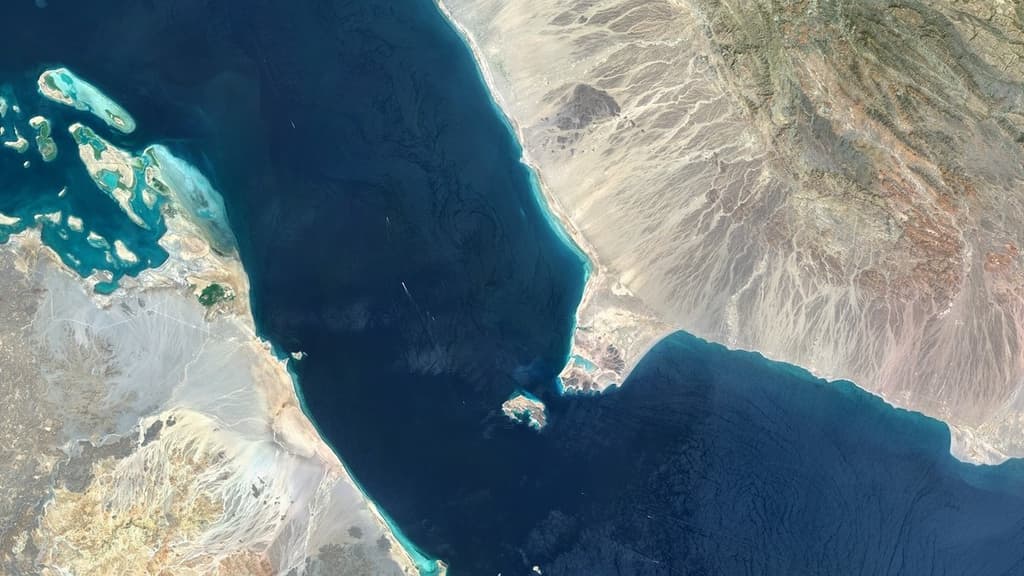
**Houthi attacks on Saudi-linked vessels and persistent Red Sea threats remain the dominant driver of Bab el-Mandeb transit volumes, keeping weekly ship counts compressed well below 2023 baselines near 400-plus.** Recent data show daily crossings stabilizing around 30–40 vessels in late August, with 48–72 hour aggregates of 60–81 transits reflecting resilient but selective traffic—primarily Chinese-flagged or non-sanctioned operators—while many carriers maintain Cape of Good Hope routing or dark AIS transits to mitigate risk. Elevated war-risk premiums and selective blockades have narrowed the distribution of outcomes, producing tight market-implied odds between the 170–189 and 190–209 bands as traders weigh sustained attacks against gradual Suez resumption by major lines and incomplete visibility into masked movements. Upcoming resolution hinges on any escalation near the strait or further carrier routing shifts.
Experimental AI-generated summary referencing Polymarket data. This is not trading advice and plays no role in how this market resolves. · UpdatedHow many ships transit Bab el-Mandeb Strait week of August 31?
How many ships transit Bab el-Mandeb Strait week of August 31?
190-209 40%
170-189 34%
210-229 22%
230+ 5%
$34,594 Vol.
$34,594 Vol.
<170
2%
170-189
34%
190-209
40%
210-229
22%
230+
5%
190-209 40%
170-189 34%
210-229 22%
230+ 5%
$34,594 Vol.
$34,594 Vol.
<170
2%
170-189
34%
190-209
40%
210-229
22%
230+
5%
Transit calls include container, dry bulk, roll-on/roll-off, general cargo, and tanker ships. Ships not reported by IMF Portwatch will not be considered.
This market will resolve as soon as all relevant data has been published. If the relevant data is not published within 14 calendar days of the specified date, this market will resolve based on the most recent data published up to that point.
In case of obvious data integrity issues (i.e., erroneous data), the market may remain open until the end of the third calendar day (ET) after the date on which such data is first released to allow for corrections. Data integrity issues refer only to clerical or other similar errors in the underlying data, and do not include cases where IMF Portwatch differs from alternative sources.
Only revisions to previously published data points made before all relevant data has been published will be considered.
The resolution source for this market will be IMF PortWatch, specifically the “Arrivals of Ships” data published for the Bab el-Mandeb Strait at https://portwatch.imf.org/pages/6b1814d64903461b98144a6cc25eb79c.
Market Opened: Aug 28, 2026, 6:08 PM ET
Resolver
0x69c47De9D...Transit calls include container, dry bulk, roll-on/roll-off, general cargo, and tanker ships. Ships not reported by IMF Portwatch will not be considered.
This market will resolve as soon as all relevant data has been published. If the relevant data is not published within 14 calendar days of the specified date, this market will resolve based on the most recent data published up to that point.
In case of obvious data integrity issues (i.e., erroneous data), the market may remain open until the end of the third calendar day (ET) after the date on which such data is first released to allow for corrections. Data integrity issues refer only to clerical or other similar errors in the underlying data, and do not include cases where IMF Portwatch differs from alternative sources.
Only revisions to previously published data points made before all relevant data has been published will be considered.
The resolution source for this market will be IMF PortWatch, specifically the “Arrivals of Ships” data published for the Bab el-Mandeb Strait at https://portwatch.imf.org/pages/6b1814d64903461b98144a6cc25eb79c.
Resolver
0x69c47De9D...**Houthi attacks on Saudi-linked vessels and persistent Red Sea threats remain the dominant driver of Bab el-Mandeb transit volumes, keeping weekly ship counts compressed well below 2023 baselines near 400-plus.** Recent data show daily crossings stabilizing around 30–40 vessels in late August, with 48–72 hour aggregates of 60–81 transits reflecting resilient but selective traffic—primarily Chinese-flagged or non-sanctioned operators—while many carriers maintain Cape of Good Hope routing or dark AIS transits to mitigate risk. Elevated war-risk premiums and selective blockades have narrowed the distribution of outcomes, producing tight market-implied odds between the 170–189 and 190–209 bands as traders weigh sustained attacks against gradual Suez resumption by major lines and incomplete visibility into masked movements. Upcoming resolution hinges on any escalation near the strait or further carrier routing shifts.
Experimental AI-generated summary referencing Polymarket data. This is not trading advice and plays no role in how this market resolves. · Updated


Beware of external links.
Beware of external links.
Frequently Asked Questions